jueves, 1 de octubre de 2015
Nueva Version disponible
Desde hoy está disponible la versión 2.2 rc2 donde corrijo una serie de errores en la version inmediatamente anterior; las próximas versiones continaré corrigiendo errores.

viernes, 11 de julio de 2014


New Plots and transformation available
Salstat2 has more graphics to plot


- Box-Cox normality plot
- Box-Cox linearity plot
- Lag Plot
- 4-Plot: it has a histogram, a run sequence plot, a lag plot and a normal plot. It's used to see the normality of a data series
Also it's available the Box-Cox transformation.
domingo, 29 de junio de 2014
Manual en español
Muy buen día
Me place anunciar que estoy elaborando el manual de Salstat2 en español, de momento contiene informacion sobre la interface grafica de usuario sin embargo seguiré elaborandolo para que sea mas completo y sea mas util. Sin mas premabulo, adjunto la primer vesion en español del documento.http://www.4shared.com/office/7DsAMYOGba/Salstat2_help_es_v22_alpha_3.html
Me place anunciar que estoy elaborando el manual de Salstat2 en español, de momento contiene informacion sobre la interface grafica de usuario sin embargo seguiré elaborandolo para que sea mas completo y sea mas util. Sin mas premabulo, adjunto la primer vesion en español del documento.http://www.4shared.com/office/7DsAMYOGba/Salstat2_help_es_v22_alpha_3.html
lunes, 23 de junio de 2014
Salstat2 v 2.2 alfa 3 disponible
A partir de la fecha está disponible la vesion 2.2 alfa 3 del programa, en esta version se incorporan nuevas funcionalidades y se corrigen muchos bugs, al respecto se puede mencionar las siguientes adiciones:


- Se incluye la libreria numpy 1.8.0 y scipy 0.14: mediante el uso de pyinstaller se remueve la limitante de utilizar una version mas antigua de dicha librería.
- Se adiciona la opcion de hacer zoom con el scroll del raton sobre las gráficas.
- El programa permite importar modulos creados por el usuario y los carga dinámicamente al iniciar la aplicación.
- La version de pivot table incluida está en desarrollo por lo que no es completamente funcional.
- Se rehubicó la barra de herramientas para el panel de programación, tambien se organiza el tamaño del control visor de la barra de herramientas
- Se organiza el codigo en forma interna para una mejor interpretacion de los eventos.
domingo, 22 de diciembre de 2013
We add a frame to manage the pivot class

Since version V2.2 alpha3 we will add a frame to create a pivot table.
jueves, 19 de diciembre de 2013
Easy dialog has a better position of its controls
We have changed arrange of the controls of the easyDialog class in order to be more pleasant than the previous version by using a flexgrid sizer.
New display


New display


lunes, 9 de septiembre de 2013
Salstat2 en idioma español
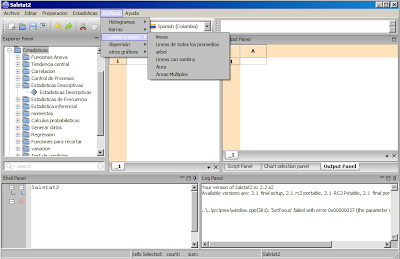
Hola a todos, nos complace anunciar que Salstat2 estará disponible en el idioma español desde su versión 2.2 a2, a continuación dejo unas capturas de pantalla.

Recuerda que este software tambien esta hecho desde Colombia y Australia


miércoles, 28 de agosto de 2013
salstat2 softpedia contributors
Today i received this message from softpedia:
Salstat2, one of your products, has been added to Softpedia's database of software programs for the Windows operating system
To assure our visitors that Salstat2 is clean, we have granted it with the "100% FREE" Softpedia award. To let our users know about this certification, you may display this award on your website, on software boxes or inside your product.

http://www.softpedia.com/get/Others/Home-Education/Salstat2.shtml
Salstat2, one of your products, has been added to Softpedia's database of software programs for the Windows operating system
To assure our visitors that Salstat2 is clean, we have granted it with the "100% FREE" Softpedia award. To let our users know about this certification, you may display this award on your website, on software boxes or inside your product.
lunes, 26 de agosto de 2013
salstat2 plot panel
The plotting panel has been redesign to be more friendly and intuitive, this update will be available since version 2.3.


domingo, 26 de mayo de 2013
Transformation panel
Salstat2 will change it's transformation panel by a new one

The transformation panel has four panels:
- The available functions panel: where you can search an available function inside the three or by using the search control
- The related help panel: it's located in the buttom, it will change it's contents as the user select an available functionint the panel 1.
- Available columns panel: here you can select the names of the avaiable columns with data in the current grid.
- Central panel: it has a popup control to select the destiny variable, also a text control to write a custom transformation to the target variable and a related botoms to work as a hand calculator interface.
jueves, 28 de febrero de 2013
Salstat2 screen shot on Mac OS
Hi the following is an screen shot of the Salstat2 on the Mac OS Operative System and it was provided by Mark livingstone


sábado, 9 de febrero de 2013
Easily find an statistical function
S2 allow you to interactive search for an statistical function by a provided panel in the left hand side

You just need to typewrite the required statistical and S2 automatically search the related words and if possible shows a dialog.

In case you select "promedio" then you should see a dialog related to the function

Finally if you continue then you should obtan a result into the response panel


You just need to typewrite the required statistical and S2 automatically search the related words and if possible shows a dialog.
In case you select "promedio" then you should see a dialog related to the function

Finally if you continue then you should obtan a result into the response panel

martes, 18 de diciembre de 2012
Crear un cuadro de diálogo
Utilizando S2 es posible crear sus propios cuadros de diálogo, así uno muy sencillo consiste en crear un mensaje de texto, para ello se define un boton de texto con el texto a mostrar
>>> structure = list()
>>> txt1 = ('StaticText', ('Le parece sencillo!',))
>>> structure.append([txt1])
>>> dlg= dialog( struct= structure)
Se muestra el cuadro de diálogo y se verifica si presiono el boton OK en cuyo caso se muestra el texto OK
>>> if dlg.ShowModal() == _OK: print "OK"

Ahora un ejemplo de un diálogo mas avanzado


sábado, 20 de octubre de 2012
Importing csv txt files
S2 rc1 will allow you to import csv and txt files by a grafical user interface as you can see:

once you selected the file a dialog shows some options to load your file:


once you selected the file a dialog shows some options to load your file:


miércoles, 17 de octubre de 2012
Importar archivos en formato csv
Mediante el uso de la libreria numpy es posible leer archivos en formato csv, txt para ello puede seguir los siguientes pasos:
grid.PutCol(col, data[col,:])
De forma alternativa se puede utilizar un cuadro de dialogo para capturar la ruta completa del
archivo a importarm, disponible desde la version 2.1 rc1
>> path = getPath()
 La variable path contine la ruta al archivo seleccionado, en caso que se presione el boton cancelar, la variable path contine None lo cual corresponde a una varible nula.
- Identificar la ruta al archivo para importar, escribiendo una r al comienzo:
- Se importa las librerias requeridas:
- Se lee la información:
- Se lee las dimensiones:
- Se reporta en el Panel de ingreso de datos
grid.PutCol(col, data[col,:])
De forma alternativa se puede utilizar un cuadro de dialogo para capturar la ruta completa del
archivo a importarm, disponible desde la version 2.1 rc1
>> path = getPath()

domingo, 16 de septiembre de 2012
Dialog creation
S2 allows you to easy create dialog by using a provided class, the same consider the buttoms are arranged by rows for example if you like to add a row of controls then
1- allways create an empty list
structure = list()
2- define the structure of the buttoms
txt1= ['StaticText', ['row 1----']]
txt2= ['StaticText', ['row 2----']]
txt3= ['StaticText', ['row2 col2----']]
btn1= ['Choice', [['opt 1', 'opt 2']]]
3- add the buttoms to the list by rows
structure.append( [txt1])
structure.append( [txt2, txt3])
structure.append( [btn1])
4- send the list created to the dialog class
myDialog= dialog(struct= structure)
5- display the dialog and take the value of the controls
if myDialog.ShowModal() == OK: # if the user press the ok button
values= myDialog.GetValue()
show(values)
myDialog.Destroy() # destroy the dialog
show("the user press OK button")
else:
show("The user press CANCEL button")
The resulting dialog is

1- allways create an empty list
structure = list()
2- define the structure of the buttoms
txt1= ['StaticText', ['row 1----']]
txt2= ['StaticText', ['row 2----']]
txt3= ['StaticText', ['row2 col2----']]
btn1= ['Choice', [['opt 1', 'opt 2']]]
3- add the buttoms to the list by rows
structure.append( [txt1])
structure.append( [txt2, txt3])
structure.append( [btn1])
4- send the list created to the dialog class
myDialog= dialog(struct= structure)
5- display the dialog and take the value of the controls
if myDialog.ShowModal() == OK: # if the user press the ok button
values= myDialog.GetValue()
show(values)
myDialog.Destroy() # destroy the dialog
show("the user press OK button")
else:
show("The user press CANCEL button")
The resulting dialog is
jueves, 13 de septiembre de 2012
S2 software estadístico
S2 es un software estadístico de código abierto y bajo licencia GLP3 por lo que se puede utilizar en forma gratuita.

Alojado en la página
http://code.google.com/p/salstat-statistics-package-2/

A continuación algunos de los tipos de gráficos que puede realizar

S2 es la continuación del paquete de estadística salstat sin embargo ha sifrudo suficientes transformaciones como para considerarse un proyecto independiente. entre las capacidades de software se encuentran las siguientes:
- Esta diseñado en función del usuario final
- Actualmente está disponible para los sistemas operativos Windows y Mac
- Está escrito originalmente para el idioma ingles pero actualmente está casi totalmente traducido al idioma español
- Permite el uso de línea de comandos permitiendo al usuario final la posibilidad de interactuar dinámicante con los objetos del programa
- El programa es escriptable y sensible a la sintaxis de python por lo que colorea con base en palabras claves.
- Soporta mas de 50 funciones estadísticas al mismo tiempo incluye la librería numpy para el cálculo numérico
- Incluye 21 tipos diferentes de gráficos al mismo tiempo permite manipular dichos gráficos en forma interactiva y también permite guardar los gráficos creados en mas de 10 formatos diferentes.
- Puede leer y escribir archivos de excel 2003.
- La interface gráfica de usuario es fácil de manipular y permite maximizar, minimizar y reubicar paneles según los requerimientos del usuario final
- Permite la creación de diálogos mediante el uso de la librería wx y una clase para facilitar su uso.

A continuación algunos de los tipos de gráficos que puede realizar

Suscribirse a:
Entradas (Atom)